Comparative mapping of biographies
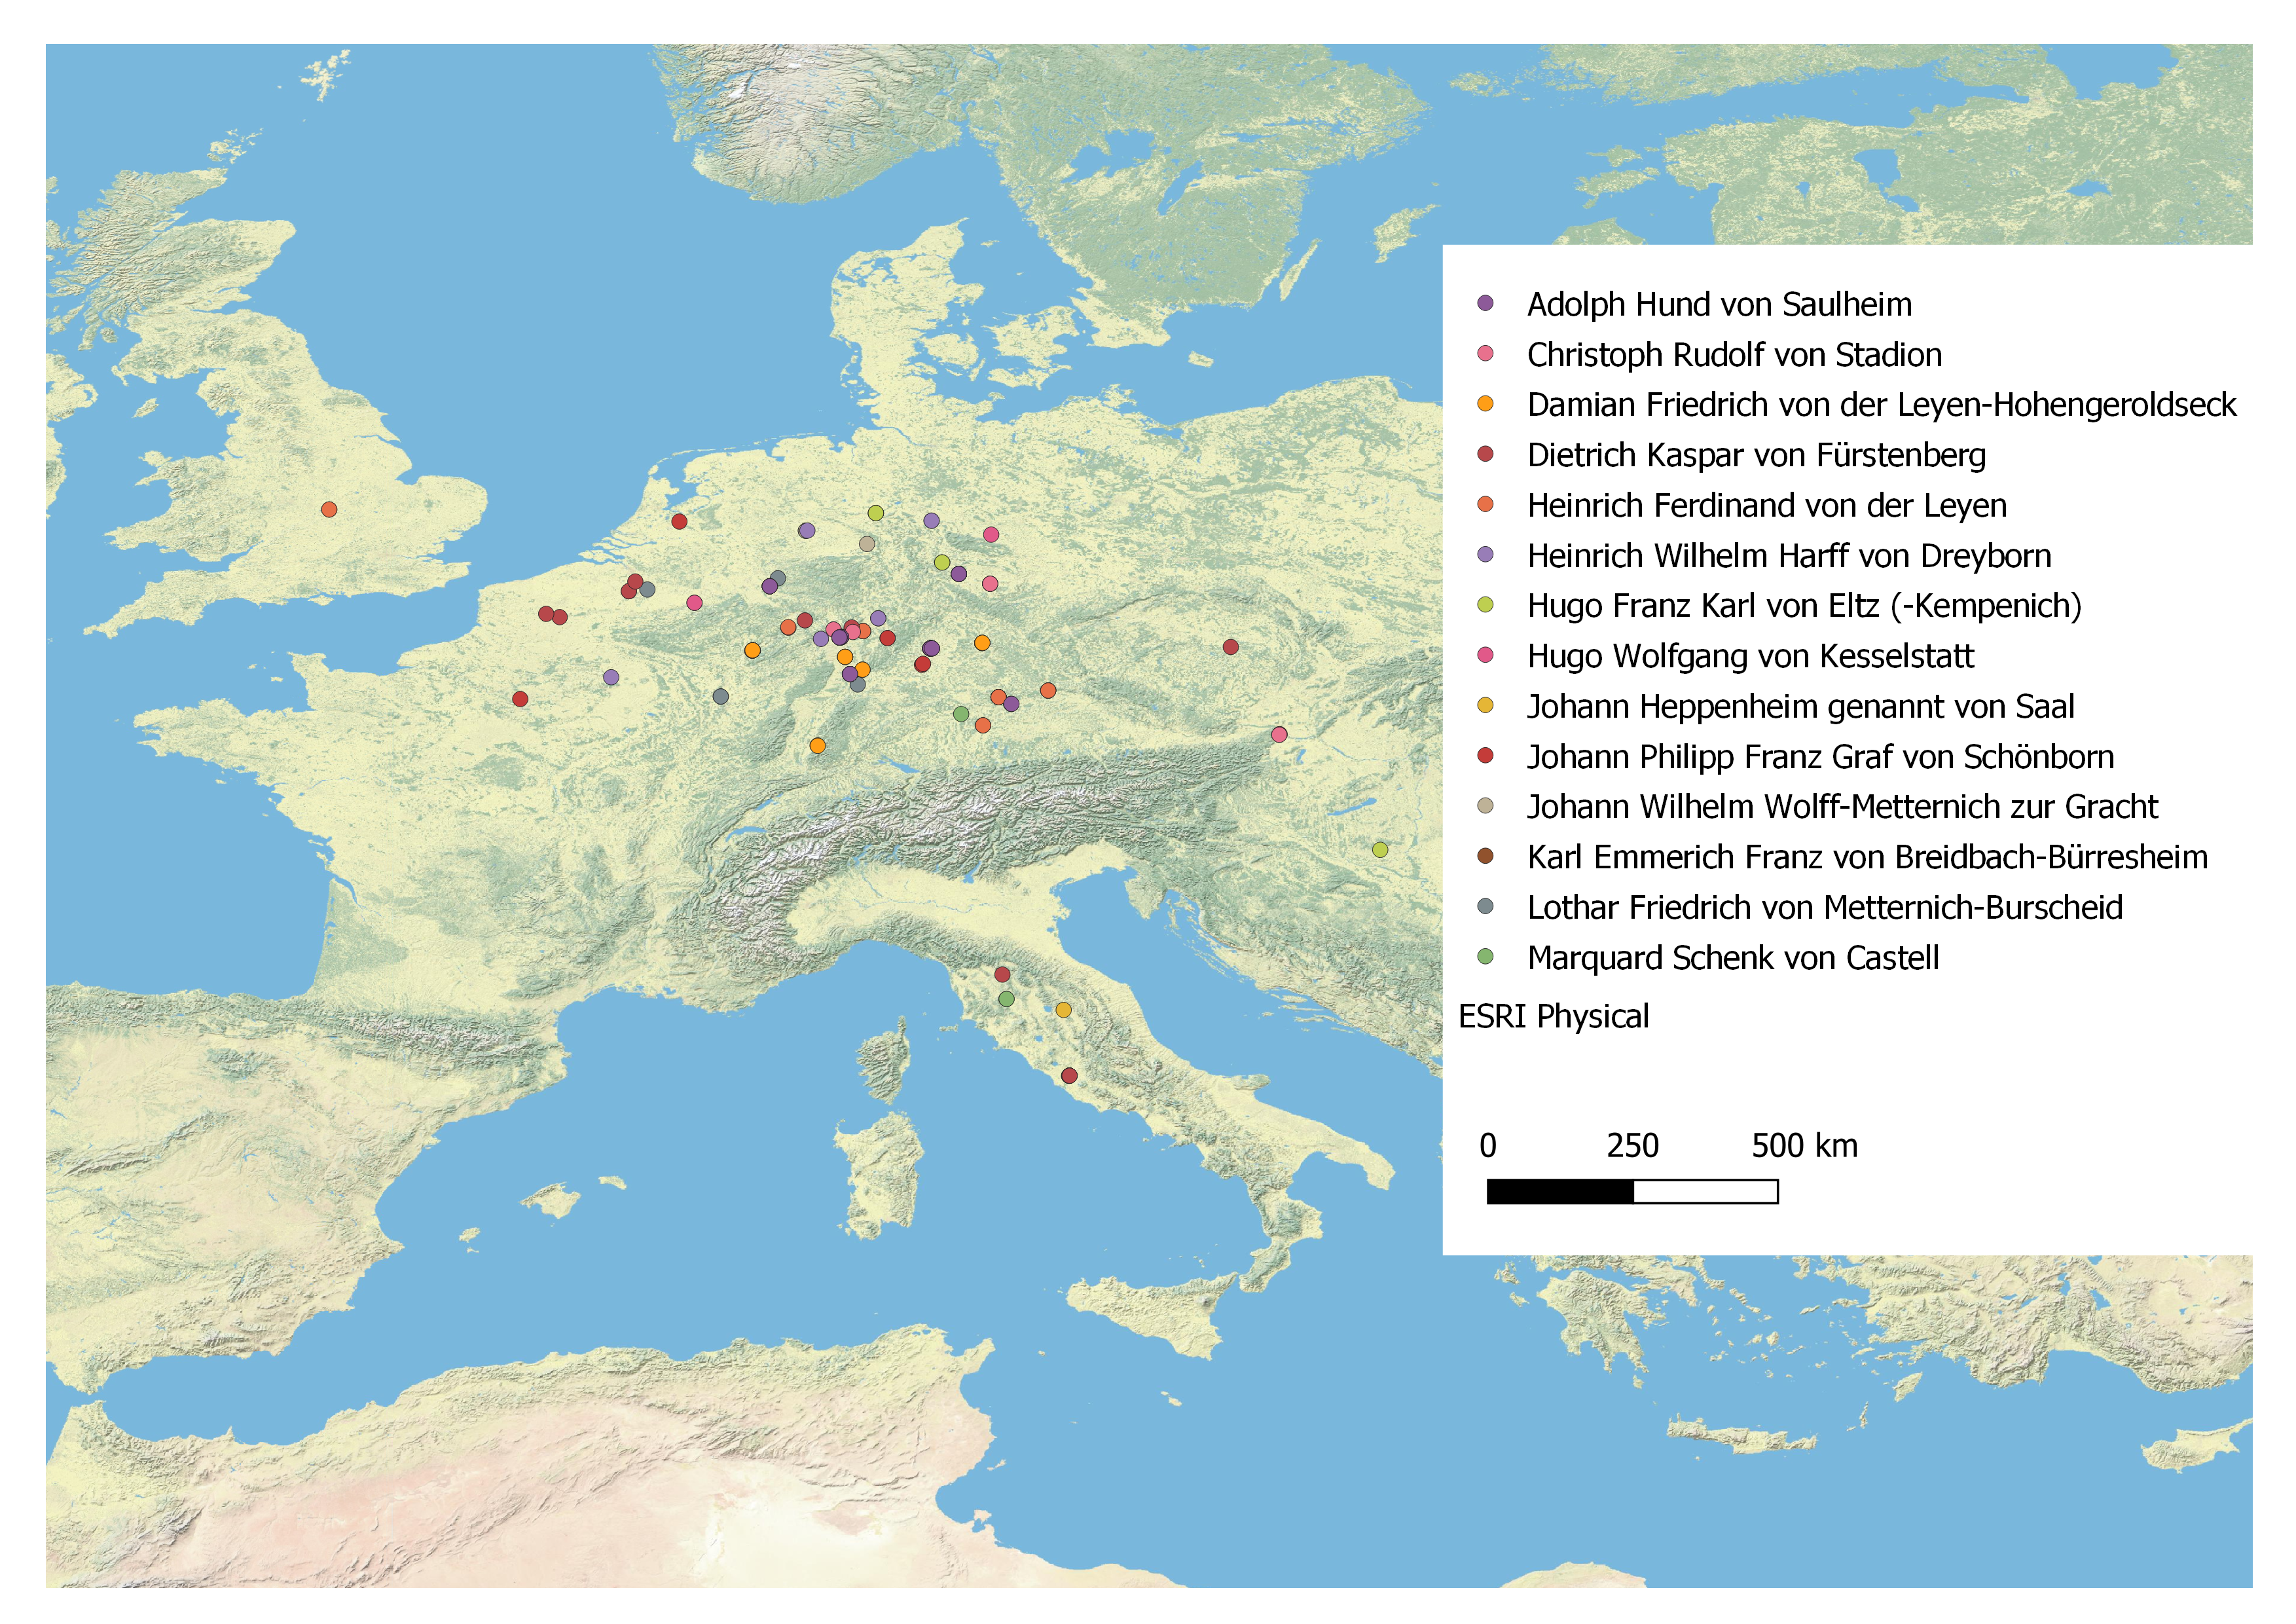
One possibility to comparatively map data is the categorised or rule-based visualisation of geometries. This visualisation conveys information based on different shapes or colours used for points, lines or polygons (cf. the QGIS documention 2.14, section 4.3. on Classification). The first map displays biographically relevant places for each cathedral provost in a different colour. While some clerics were comparatively mobile and studied far from Mainz, went on the grand tour or took on diplomatic missions, others' lives centred on the Electorate of Mainz or even the city of Mainz.
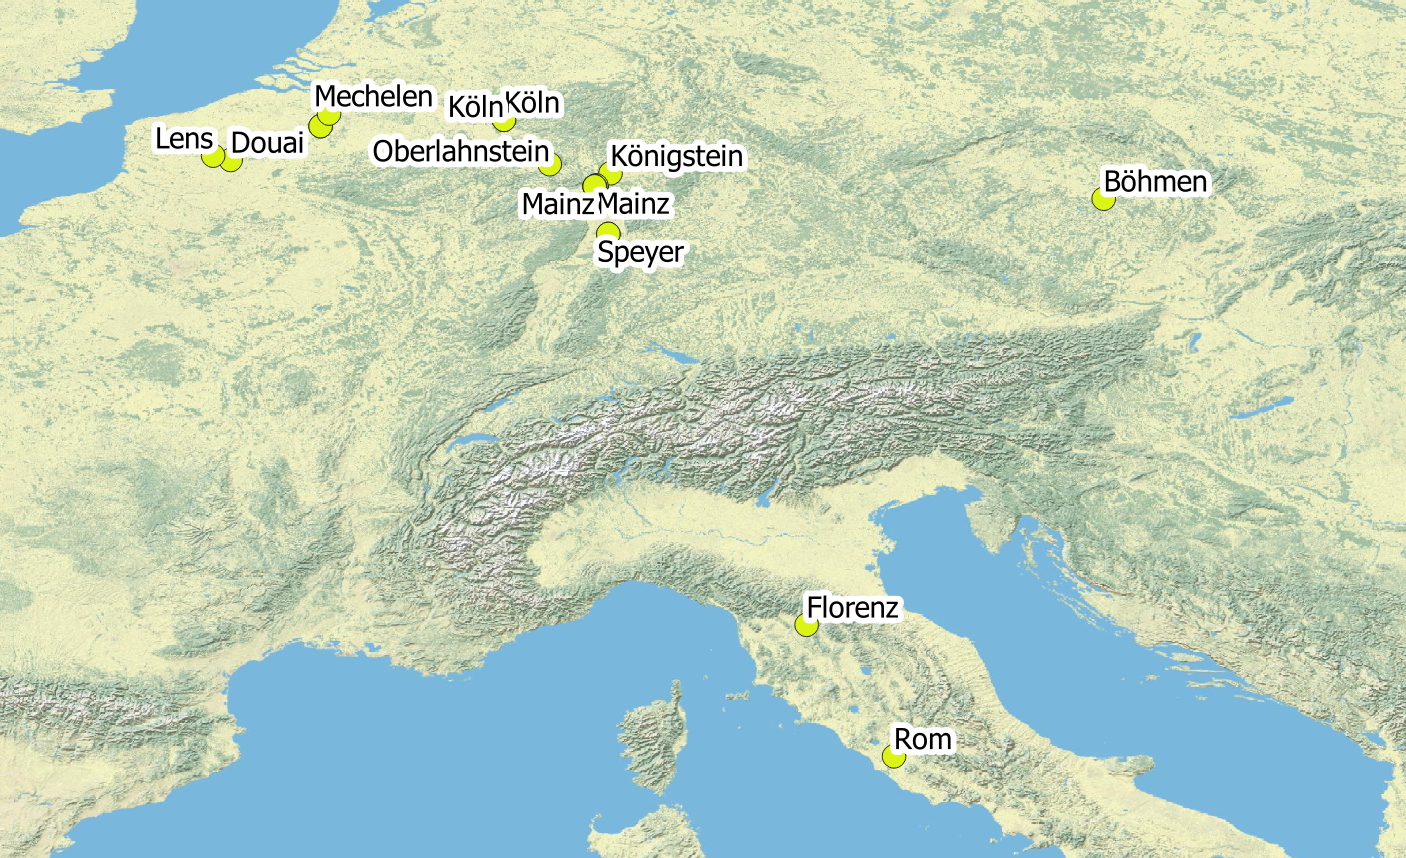
One example of a more mobile cleric in the analysed data set is Dietrich Kaspar von Fürstenberg who spent time in Florence, Rome and Bohemia as well as serveral places in present-day Belgium and France.
Foci of the maps created
The individual maps produced in the project seminar were created in two working groups. One student group concentrated on the spiritual offices held by the persons studied, the second group also considered other life events (e.g. school education, academic studies, Grand Tour, diplomatic activity, or burial). These two focal points are visible in the maps shared here.
Individual maps: number of ecclesiastical offices per place and functions
The individual maps created for each cathedral provost visualise the places and the number of ecclesiastical offices and dignities that the clerics held in the course of their lives. A larger place dot means that several functions were performed in one place. Functions in unknown places are indicated a placeholder point labelled "unknown" in the centre of Germany. The hash sign # was used to highlight unknown functions. Although only one person's career is visualised per map, the frequent spatial clustering of functions presented a challenge for the positioning of the labels. The students who created the maps had no previous QGIS experience, so the focus was placed on the content of the maps rather than design quality. As a base map, the students mainly used the OSM standard map with modern place names and infrastructures as it allows today's users intuitive spatial orientation. Where many labels were required, an ESRI satellite map was used. All maps can be downloaded in PDF format.


Maps with legends and scales
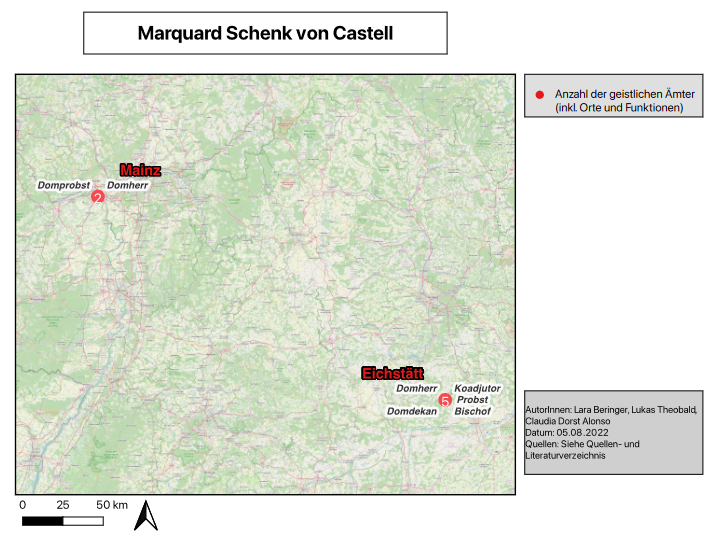
A visually more appealing solution is to add legends and scales to the maps, based on a QGIS "print layout". One such map was exemplarily created for Marquard Schenk von Kastell. It is, however, very time-consuming to create these maps and could therefore only be demonstrated for one person.
Maps created by:
Jana Charlotte Unselt, Alina Buchal, Julia Celine Jung (clerical offices)
Claudia Dorst Alonso, Lara Beringer, Lukas Theobald (general biographical events)